The M&E Engine
Removing the distance between communities and champions.
Accessibility like never before.
Making sure every rand makes sense.
No one left out: Financial • Physical • Cultural
Our automated pipeline for clinical-grade field data. Collect feedback across sites, give your team live visibility, and generate funder-ready reports without manual spreadsheets.
Six questions · Takes 2 minutes
Custom Data Collection
You deploy your survey. We collect the data. We give you the report.
Replace paper forms, manual data entry, and messy spreadsheets with an automated collection pipeline. Whether you need to measure community economic indicators, programme satisfaction, or service uptake, we configure our WhatsApp or Facebook Messenger system around your exact questions — no app download, no literacy barrier.

Voice-First & Multilingual
Respondents answer via WhatsApp or Facebook Messenger — text or voice note — in isiZulu, Sepedi, Sesotho, Afrikaans and more. No app download. No literacy barrier.
24-Hour Live Dashboard
Your live dashboard goes online within 24 hours of closing your survey. Filter by cohort, date, or facilitator.
Funder-Ready in 48 Hours
A 2-page summary report delivered within 48 hours. Attach it directly to a grant application or board report.
Who uses this?
Community-Based Organisations
“We need to survey 300 households across 4 villages about water access. We have no data team.”
Fornix: We configure in their home languages, account for literacy and disability, deploy via WhatsApp, and deliver a clean report your municipality will accept.
Corporate CSI Departments
“Our CSI partners need to prove beneficiary satisfaction for our annual report.”
Fornix: We run surveys across all partner sites simultaneously and aggregate results into a single report.
Training Providers
“We train 500 people a year but our feedback forms are a mess of paper.”
Fornix: We digitise collection via WhatsApp and deliver a dashboard you can filter by cohort, date, or facilitator.
Fornix Eligible Programmes
Start Onboarding — 6 quick questions
Fornix M&E Engine
You run a programme. You have some data. We can prove it worked.
Designed for the Monitoring and Evaluation of health and psychosocial programmes. You provide your existing data and we run it through our evaluation system to produce credible, funder-ready evidence. We plug directly into your existing database, spreadsheet, or case management system — no migration required.
Clinical Progression
We calculate the Reliable Change Index (RCI) and Cohen's d effect size to prove participant progress beyond normal measurement error.
Fidelity Analysis
We measure whether the programme was delivered as it was designed to be delivered — and flag where delivery gaps exist.
CPCIP — Cost Per Clinically Improved Participant
We calculate the metric funders are increasingly asking for: exactly how much it costs to produce one measurably improved life.
Who uses this?
Mental Health NPOs
“We run group trauma therapy. We collect PHQ-9 at intake and exit but no one ever analyses it.”
Fornix: We take your existing data, calculate the progression and effect size, and produce a scorecard proving exactly what changed and by how much.
HIV/AIDS Service Organisations
“Our donors want outcome data but we only have attendance registers and notes.”
Fornix: We work with what you have. We add our data collection layer so you can hear directly from the community you serve.
Impact Investors
“We fund 12 NPOs. We need standardised impact evidence but each measures differently.”
Fornix: We collect from all 12 and all their beneficiaries, normalise the data, and load it to a private comparative portfolio dashboard only you access.
Fornix Eligible Programmes
Start Onboarding — 6 quick questions
Fornix Score
The standard for community measurement - benchmarked and built to unlock the Funder Pool.
The Fornix Score is a standard measurement system for community mental health programmes. By using a set group of culturally adapted tools, we allow for fair comparisons across the sector. For the first time, funders can directly compare the impact of different programmes using the exact same metrics.
Five Areas of Evaluation
Programmes are scored across Clinical Impact (40%), Fidelity (20%), Efficiency (20%), Reach & Equity (15%), and Sustainability (5%).
The Funder Pool
Programmes that complete the full Scorecard process become eligible for the Fornix Funder Pool - a curated network of investors who use our Scorecard to make funding decisions.
Custom Data Collection
You deploy your survey. We collect the data. We give you the report.
Replace paper forms, manual data entry, and messy spreadsheets with an automated collection pipeline. Whether you need to measure community economic indicators, programme satisfaction, or service uptake, we configure our WhatsApp or Facebook Messenger system around your exact questions — no app download, no literacy barrier.

Voice-First & Multilingual
Respondents answer via WhatsApp or Facebook Messenger — text or voice note — in isiZulu, Sepedi, Sesotho, Afrikaans and more. No app download. No literacy barrier.
24-Hour Live Dashboard
Your live dashboard goes online within 24 hours of closing your survey. Filter by cohort, date, or facilitator.
Funder-Ready in 48 Hours
A 2-page summary report delivered within 48 hours. Attach it directly to a grant application or board report.
Who uses this?
Community-Based Organisations
“We need to survey 300 households across 4 villages about water access. We have no data team.”
Fornix: We configure in their home languages, account for literacy and disability, deploy via WhatsApp, and deliver a clean report your municipality will accept.
Corporate CSI Departments
“Our CSI partners need to prove beneficiary satisfaction for our annual report.”
Fornix: We run surveys across all partner sites simultaneously and aggregate results into a single report.
Training Providers
“We train 500 people a year but our feedback forms are a mess of paper.”
Fornix: We digitise collection via WhatsApp and deliver a dashboard you can filter by cohort, date, or facilitator.
The Fornix Difference
Clinical work at community scale.
Platform Capabilities
The infrastructure powering every product.
Real-time Data
Collection across multiple programme sites simultaneously with instant sync.
Live Dashboards
Updated for programme managers as soon as data is submitted from the field.
Automated Reports
Formatted specifically for funder and board requirements with zero manual work.
Cross-site Comparison
Identify what's working, where, and why with powerful comparative analytics.
Longitudinal Tracking
Measure meaningful change over years, not just months, with robust data architecture.
Data in motion.
A platform built to handle the complexities of field data, so your team can focus on the humans behind it.
The Fornix Difference
We Don't Just
Track Impact.
We Engineer It.
Computational Psychometrics
Traditional Monitoring & Evaluation (M&E) is retrospective - it tells you what happened too late. Fornix uses Statistical Machine Learning (SML) and Computational Psychometrics to tell you what is working now, why it works, and how to scale it efficiently.
Instead of relying on retrospective manual surveys, our AI Infrastructure ingests real-time data directly from the people, where public benefit programs operate. By applying dimensionality reduction and Item Response Theory (IRT), we drastically reduce testing time and increase the diversity of people we can cater to. We identify the specific, high-impact variables that drive true community development.
This means true accessibility: we can include people who cannot read, increase access for disabled community members, and cater to grannies and kids who express themselves best in their home languages - be it IsiZulu, Tshivenda, Sesotho, Afrikaans, or any other language!

Three Dimensions of Evaluation
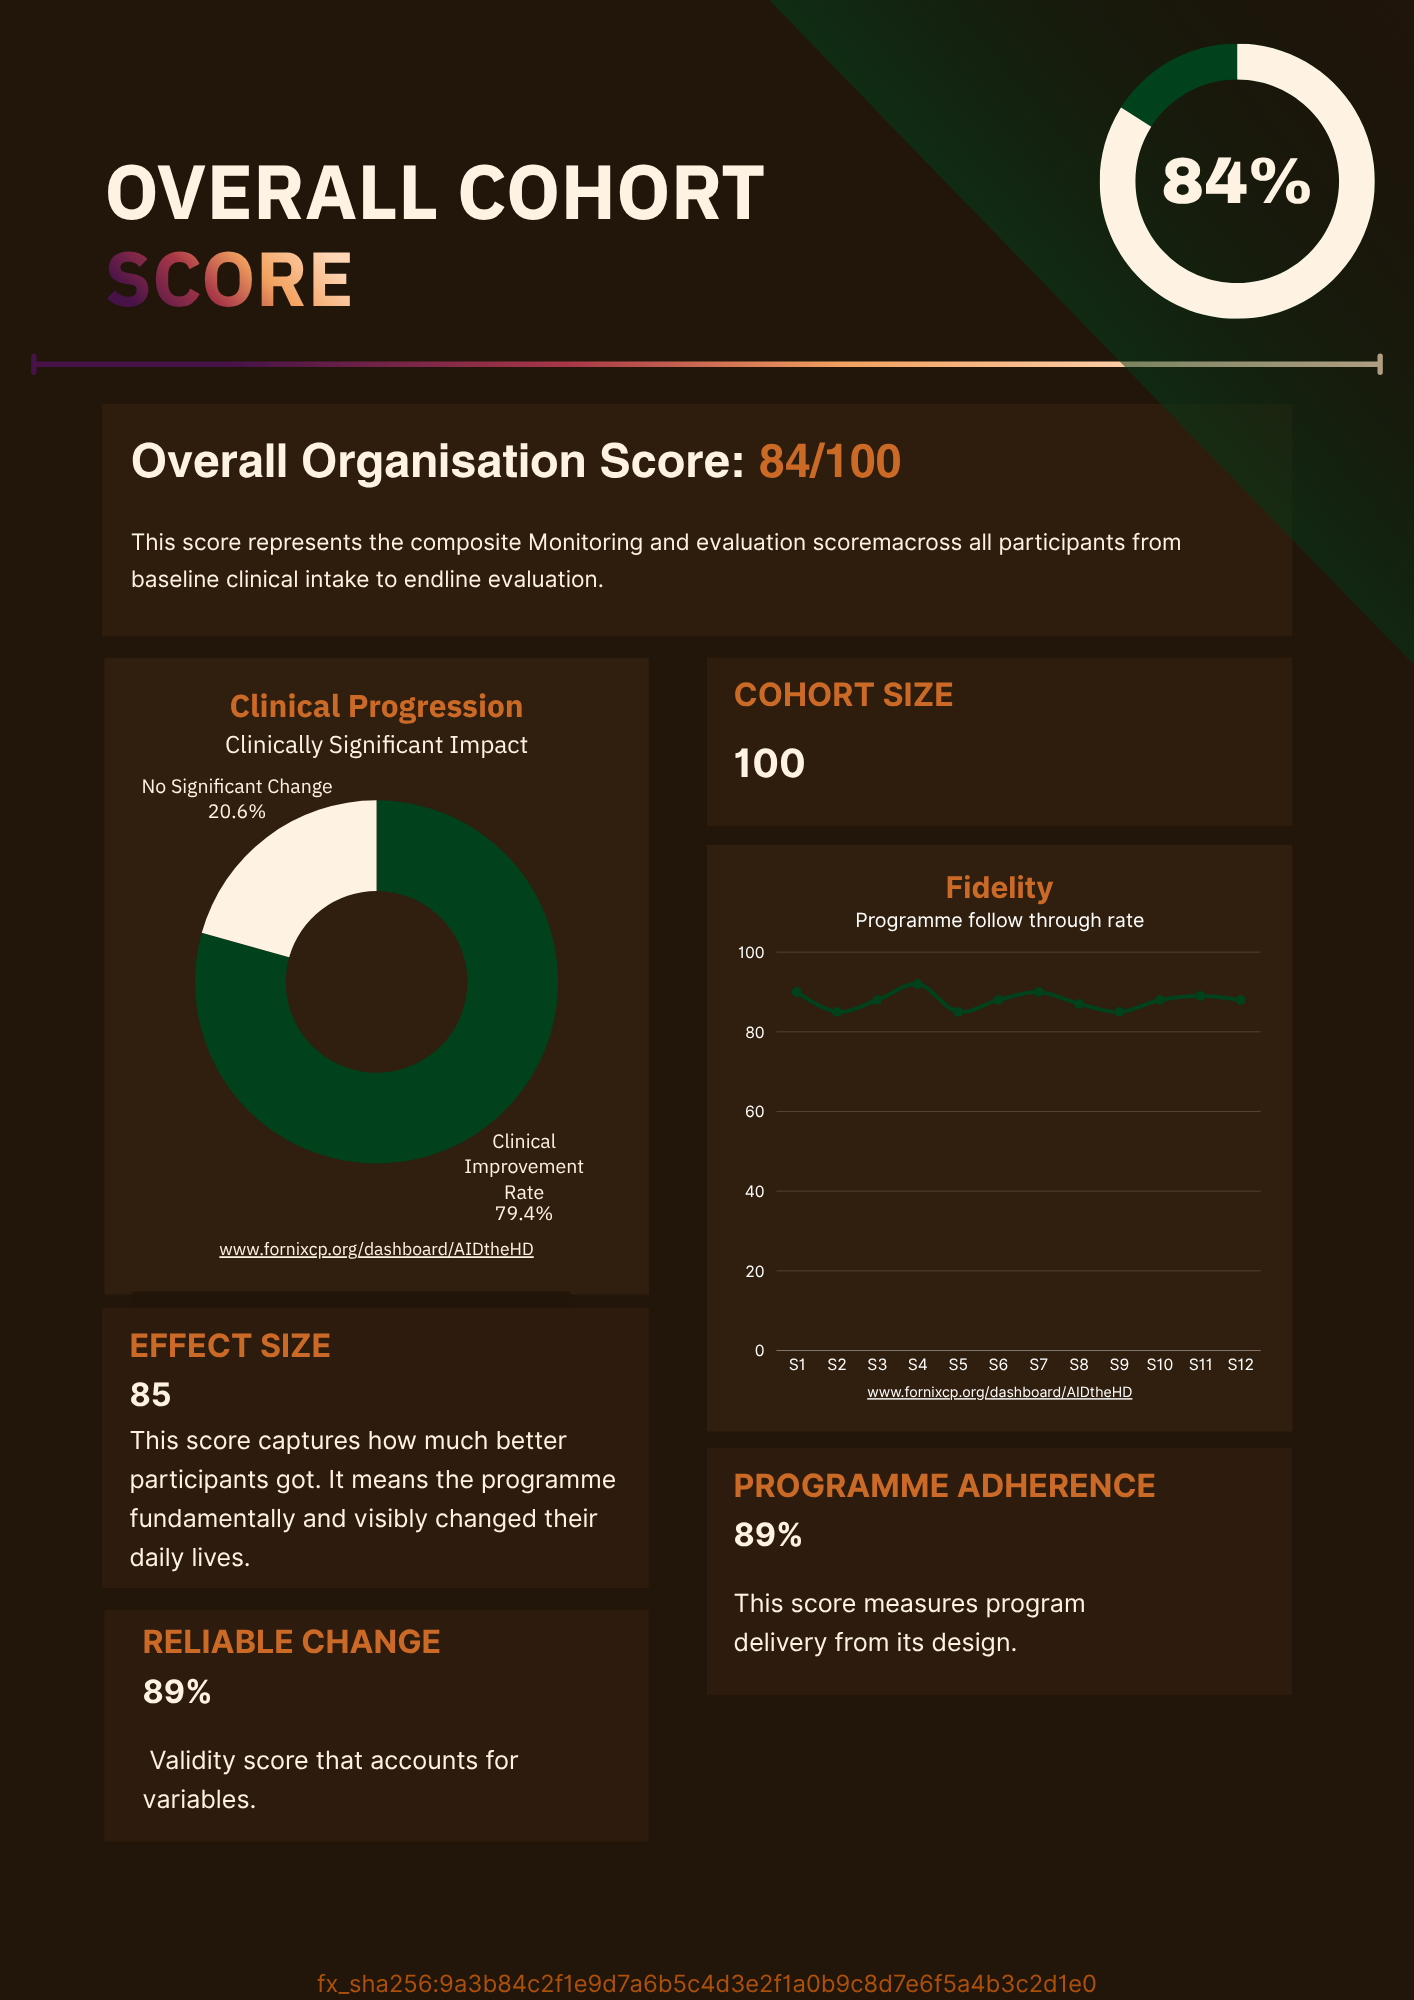
Our M&E Engine evaluates your project across three dimensions.
Fidelity
The BlueprintMeasuring how closely your goal, dream or mission for a community lives up to its reality. Are you helping people where you really wanted to?
Impact
The ResultMoving beyond 'numbers reached' to 'lives changed.' We use Mixed-Effects Models to quantify community growth, reducing having to prove for yourself to donors.
Efficiency
The EngineAn analysis of your organizational health, ensuring your operational models are lean, scalable, audit-ready, and build community development from the ground up.
